Summary of findings
By its Decision adopted on the 8th of February 2023, pursuant to the provisions of Law 4886/2022 (Article 12 par. 2 subpar. s), the Hellenic Competition Commission launched a mapping study on the conditions of competition in the product markets for: (a) laundry detergents, (b) fresh whole milk, (c) baby milk, (d) cheese and (e) cow yoghurt.
According to the above provisions, “The Hellenic Competition Commission may initiate a mapping study to assess the competitive conditions of competition in any market or sector of the economy, when required for the effective exercise of its powers”.
The purpose of the market mapping with regard to the above products is to extend the HCC’s investigation launched into a number of products by the sector inquiry into basic consumer goods and the relevant final report published in March 2021, also following the creation of the HCC’s Consumer Goods Task Force, taking into account the latest developments in the market due to the significant price increases in certain product categories, changes in consumer habits and measures adopted by the State.
Market mappings allow the HCC to investigate, in a relatively short period of time, issues mainly pertaining to market organisation and structure that are raised in the markets concerned, and to better target any possible ex officio investigations, or other types of its interventions in the relevant markets. These mappings are part of the HCC's activities aimed at dealing with high prices on the market as well as at increasing the effectiveness of its investigations to detect possible anti-competitive practices in the markets for basic consumer goods.
In particular, the mapping study on fresh cow’s milk markets focuses on: (a) the analysis of suppliers’ shares (for both private label and branded products) in the upstream supply market as well as of the SM’s supply market shares, (b) the effect of the Household Basket (HB) mechanism on prices of branded and private label products, in particular the evolution of prices of selected HB products, before and after their inclusion in the HB, by also comparing, in terms price evolution, private label products (where applicable) with branded products, included and not included in the HB, (c) the HB’s effect on consumers' purchasing habits and d) the analysis of the costs and profit margins.
In the context of this Mapping study, questionnaires were sent by the Directorate-General for Competition to 11 retailers (SMs,) operating in the above markets. It is noted that these 11 SMs hold an aggregate market share of more than 95% of the food retail sector.
The main findings of the mapping of the market for fresh cow’s milk are listed below:
In terms of sales shares
- On the supplier side, on the basis of the data provided by the 11 SMs operating in the Greek territory, the largest shares in sales (by value) among fresh cow's milk suppliers, regarding all products, throughout the period of reference (Feb. 2022 - Feb. 2023) no undertaking was found to hold a market share over 30% in all branded and private label fresh milk products, except for one undertaking which holds a market share ranging between 40-50% in the product category of private label fresh milk.
- On the SM side, during the period considered (Feb. 2022- Feb. 2023), on the basis of the data provided by the 11 SMs operating in the Greek territory, no undertaking was found to hold a share over 30% in terms of fresh milk sales value.
In terms of price evolution
- Regarding price evolution (weighted average price net of VAT), the data provided by the 11 SMs show that, from February 2022 to the end of January 2023 the weighted average price net of VAT per litre has increased from 1.04€/l at 1.25 €/l (an increase +20%). At the same time, the quantity sold by the SMs increased by 5.8% in the same period. There is a drop in the sales volume in the interim, possibly due to seasonal factors.
Total sales volume by SMs and Weighted Average Shelf Price (net of VAT)
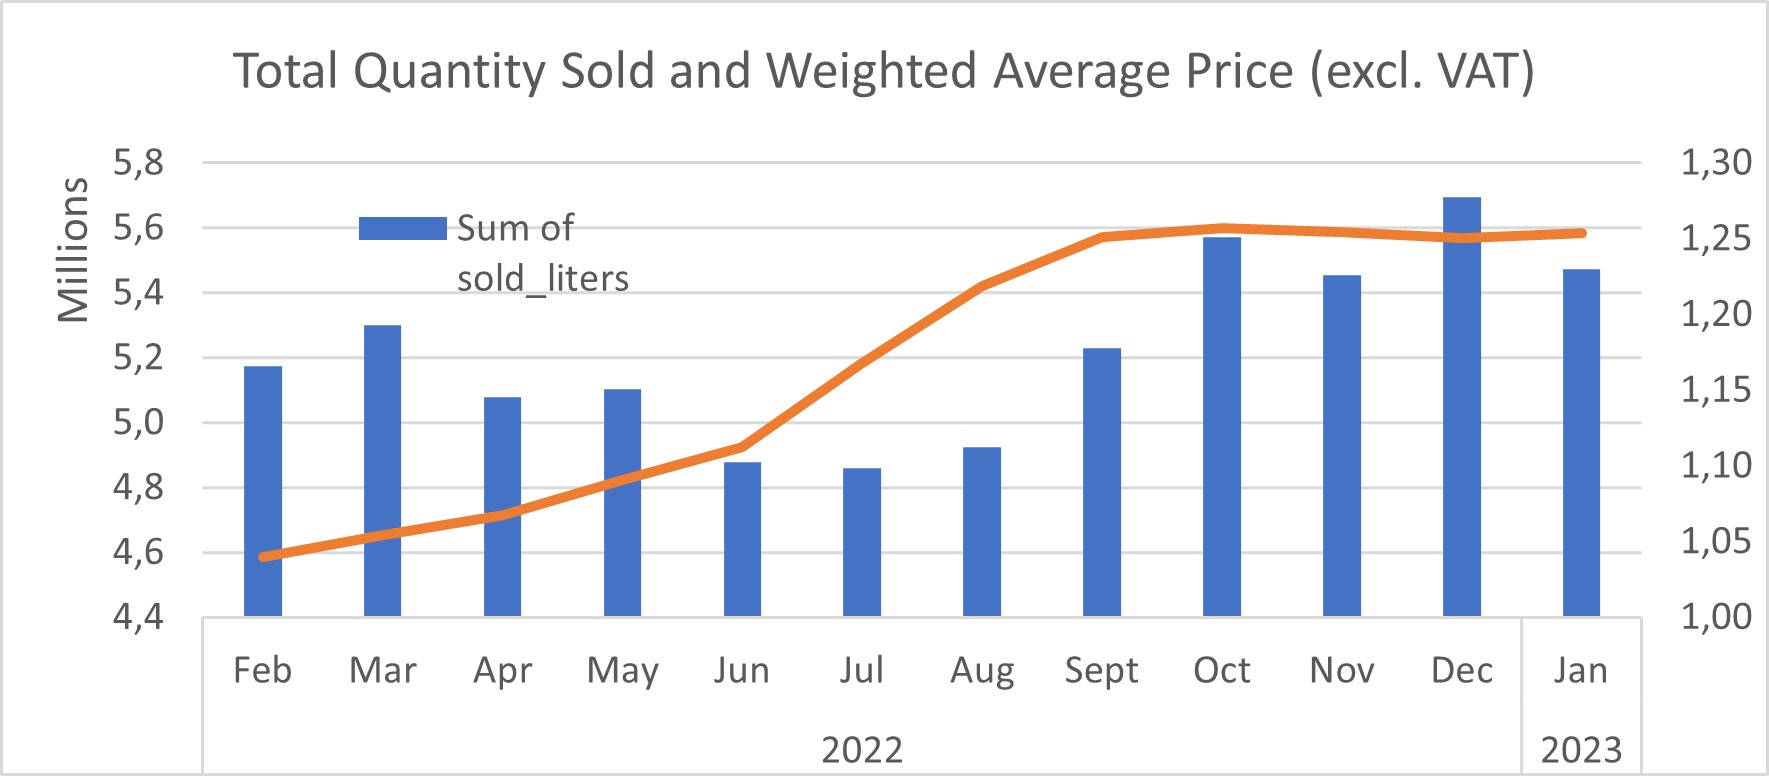
Source: Data provided by undertakings, Calculations by the HCC
- Regarding the effect of the implementation of the Household Basket on the prices of fresh cow's milk over the reference period, it is noted that: the average price of products included in the HB is significantly lower than that of products not included in the HB, mainly because of the selection of private label products that have already a higher price than branded products.
- Examining the effect of the inclusion (exclusion) of the products in (from) the HB on their price at the time of their inclusion (exclusion) in (from) the HB, a negative (positive) effect of the price of the products is observed at the time of their inclusion (exclusion) in (from) the HB.
Overall, the HB had a downward effect on prices but only for the products included in it.
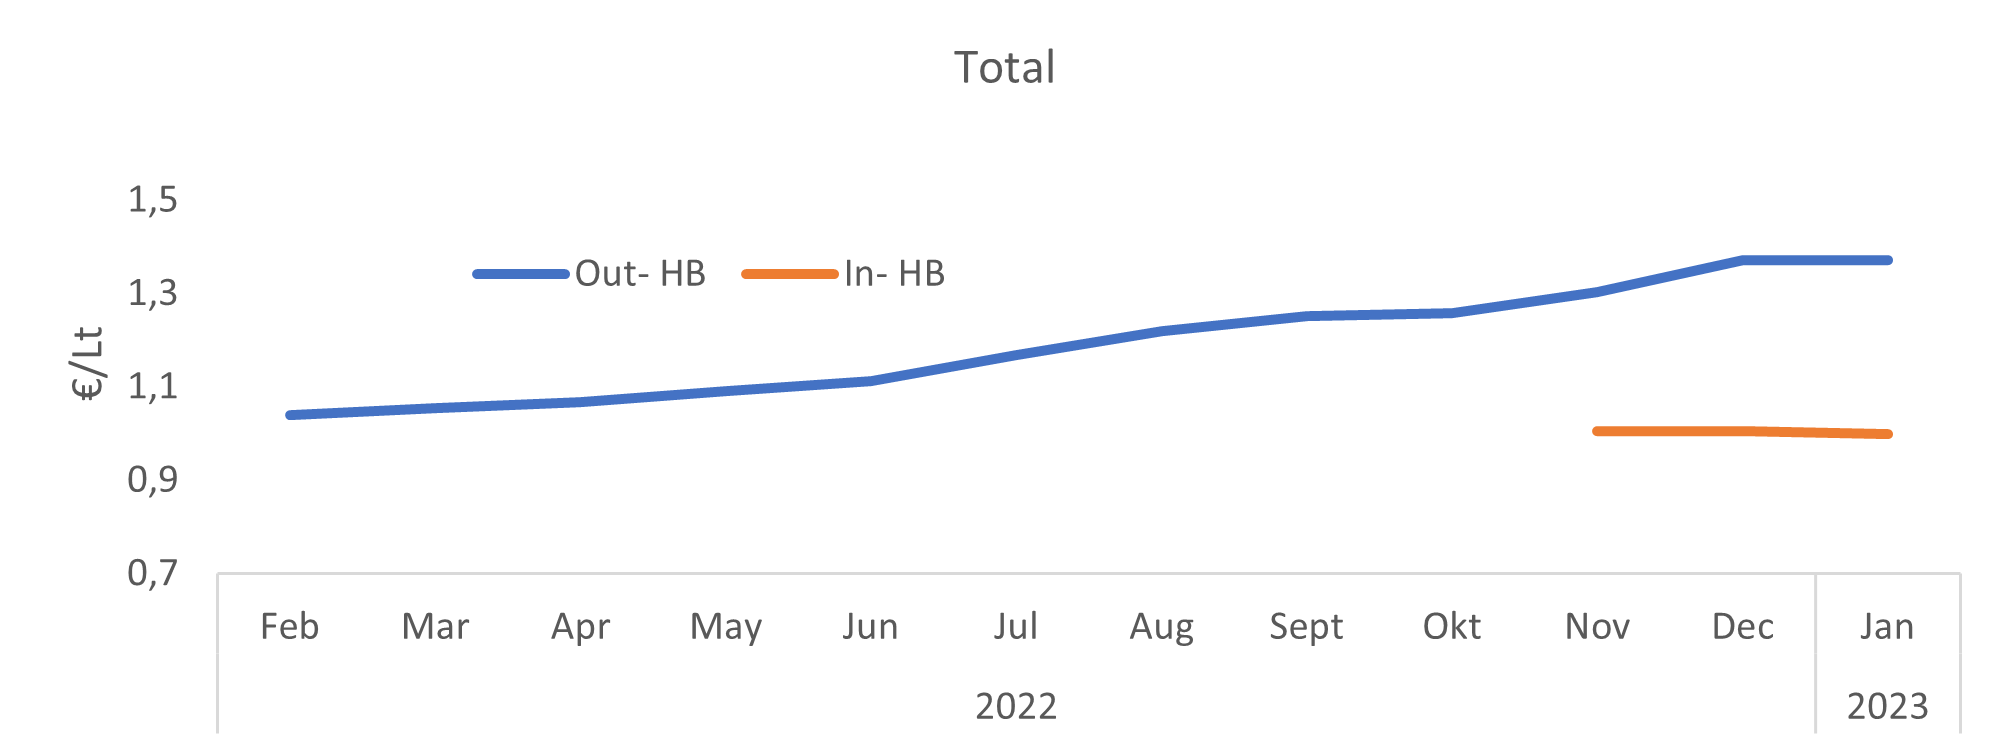
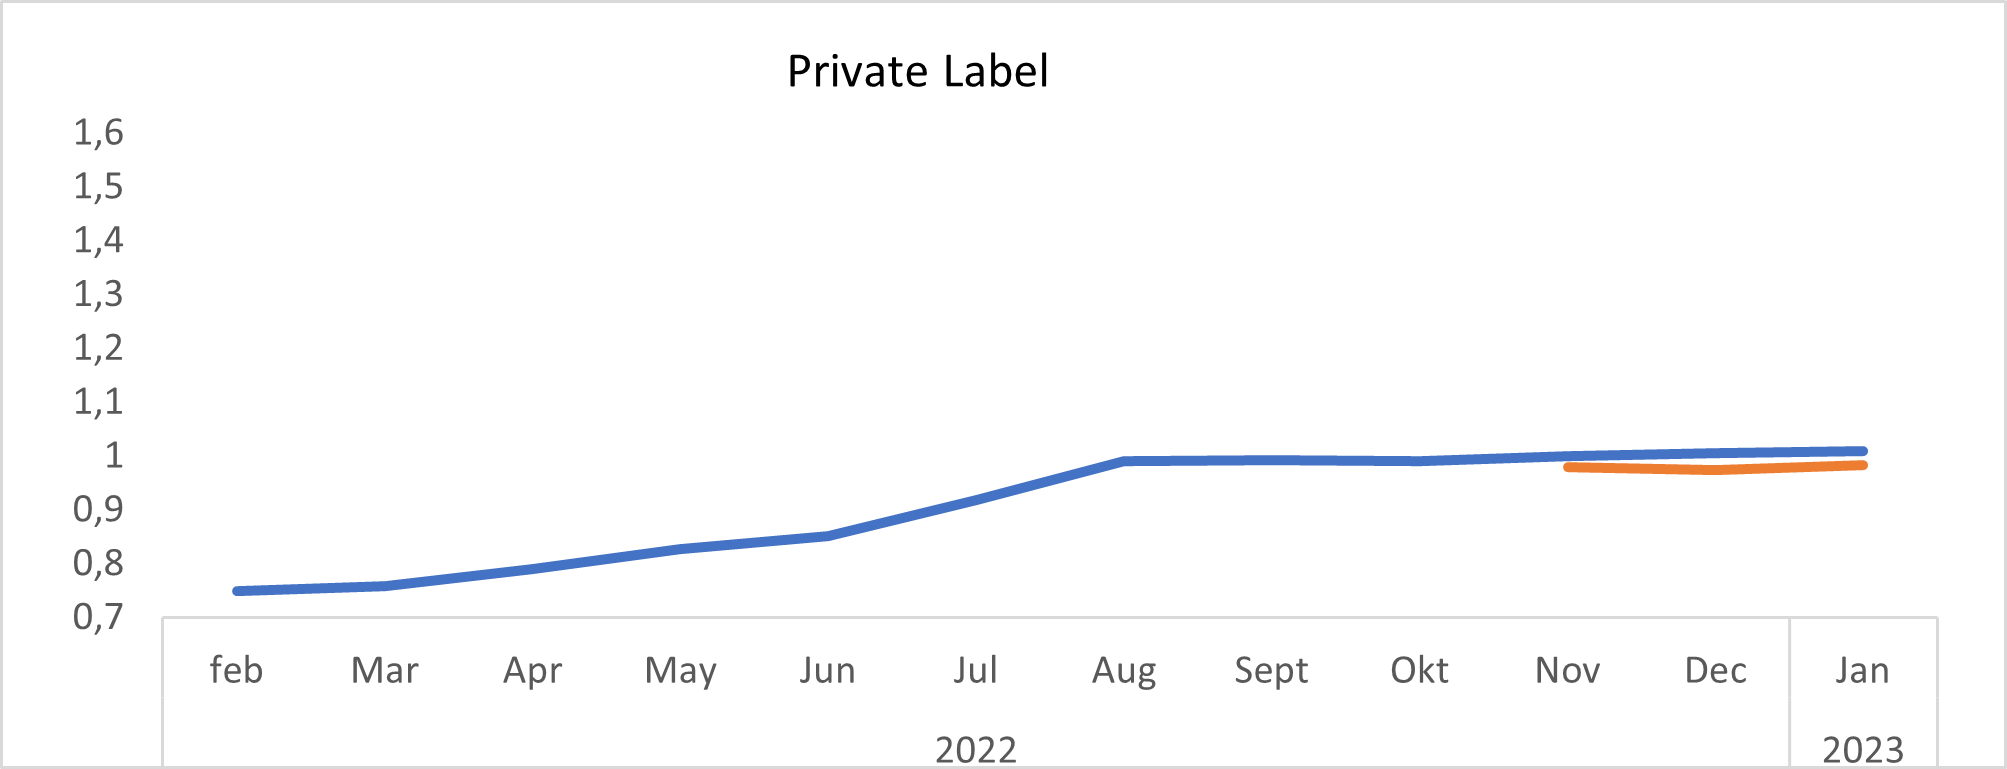
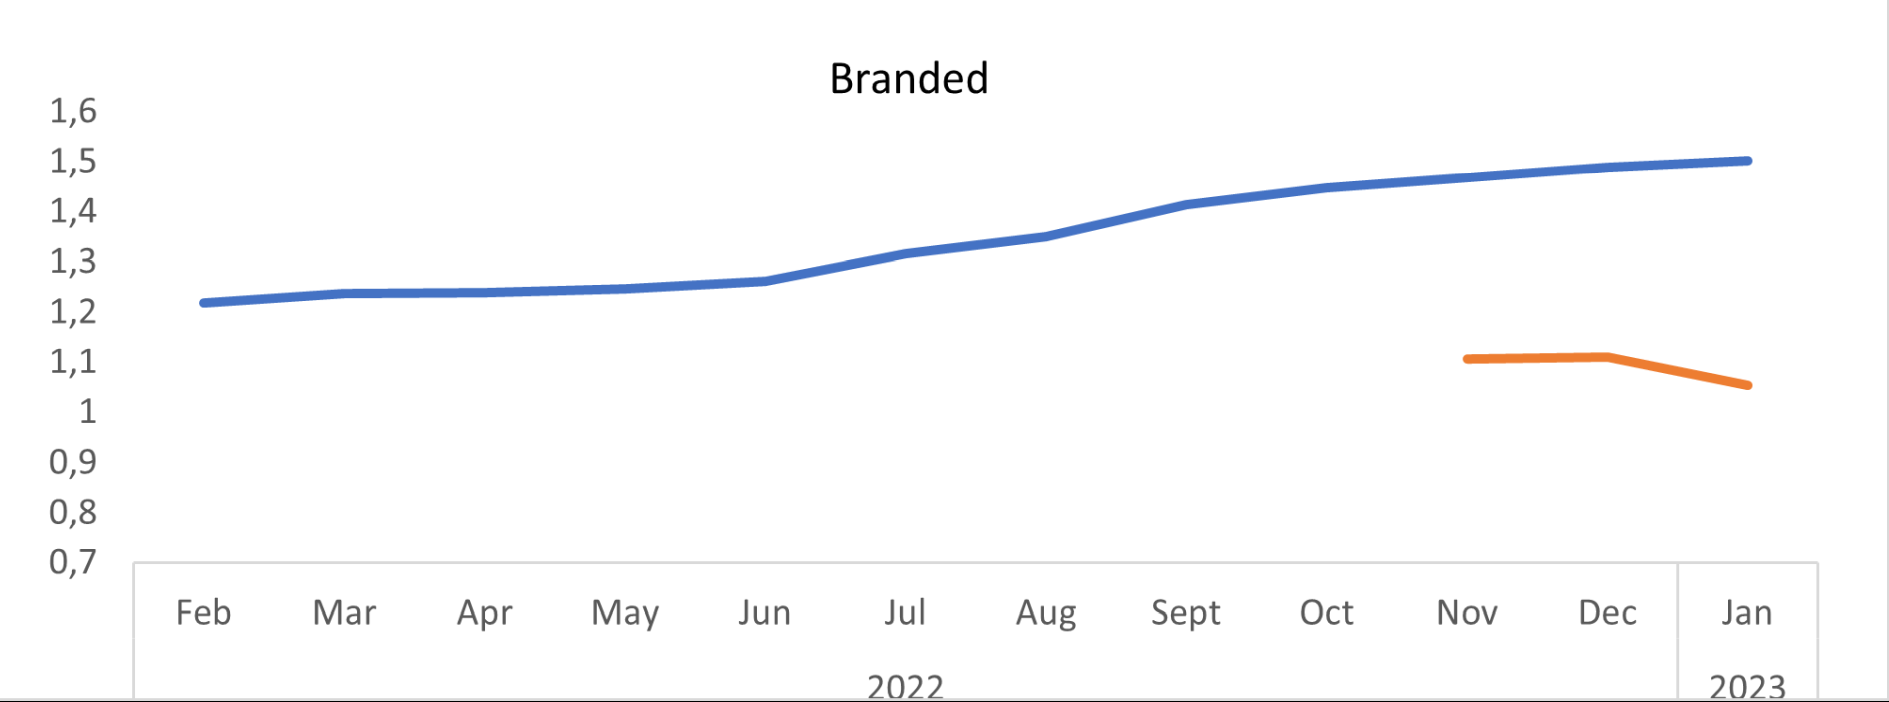
Source: Data provided by undertakings, Calculations by the HCC
- Based on the fixed-effects regression analysis using panel data, where the product is defined as the combination of SMs and barcodes and the time variable is defined as the date/price (log normalized price), the price of the products entering the HB which is reduced on average by 6.4%, while the price (log normalized price) of the products removed from the HB increases on average by 6.4%. Adding interaction dummy variables for the private label products we observe that the average price reduction for branded products from being added to the HB is -12%, while for private label products it is -4.2%.
In terms of consumer preferences
- It was observed that, for the period considered (1/2/2022- 1/2/2023), consumers are turning to private label products with an increase in the share of these products in the total sales volume, ranging from 34%-39% before HB implementation to 39%-40% during HB implementation.
- Consumers switch to the HB for fresh cow's milk with an increase in the share of the HB product sales volume from 16% in the first month of the HB’s implementation (Nov 2022) to 33% in December 2022 and to 31% in January 2023.
Cost Analysis in the Fresh Cow's Milk Value Chain
- In the context of this mapping study, questionnaires were sent by the Directorate-General for Competition to 4 Processing Firms and 5 Retailers (Supermarkets) active in the production and sale of fresh cow's milk.
- The 5 S/M Retailers represent 78% of the retail food sector (Nace code 47.11). 4 Processing Firms represent 37% of the Dairy and Cheese factories (Nace code 10.51). Data on livestock farmers were obtained from data published by ELGO - Dimitra on the selling price of fresh cow's milk and Eurostat on the cost structure which were found to be largely in line with sample data provided by ETHEAS (National Union of Agricultural Cooperatives).
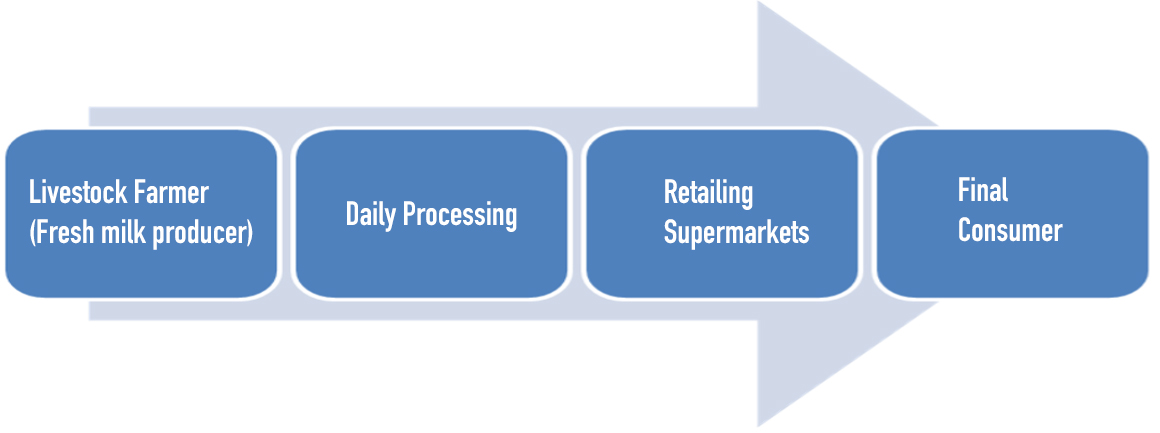
- The value chain considered here concerns the livestock farmer and milk producer who sells fresh milk to dairy industries to produce the final product, i.e. fresh cow's milk at a ratio of 1.01:1, as the wasted material in milk production is minimal. The next stage of the chain considered is the retail trade of fresh cow's milk and, in particular, Supermarkets, from which consumers purchase fresh cow's milk.
- Sales made by processing firms active in the HORECA, exports and sales to other food outlets have not been taken into account.
On the side of primary production in Greece,
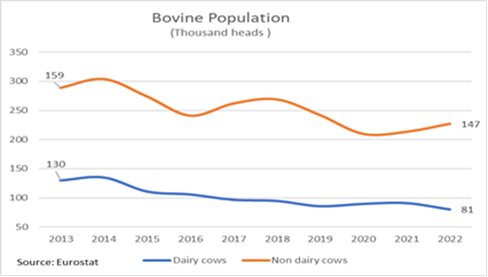
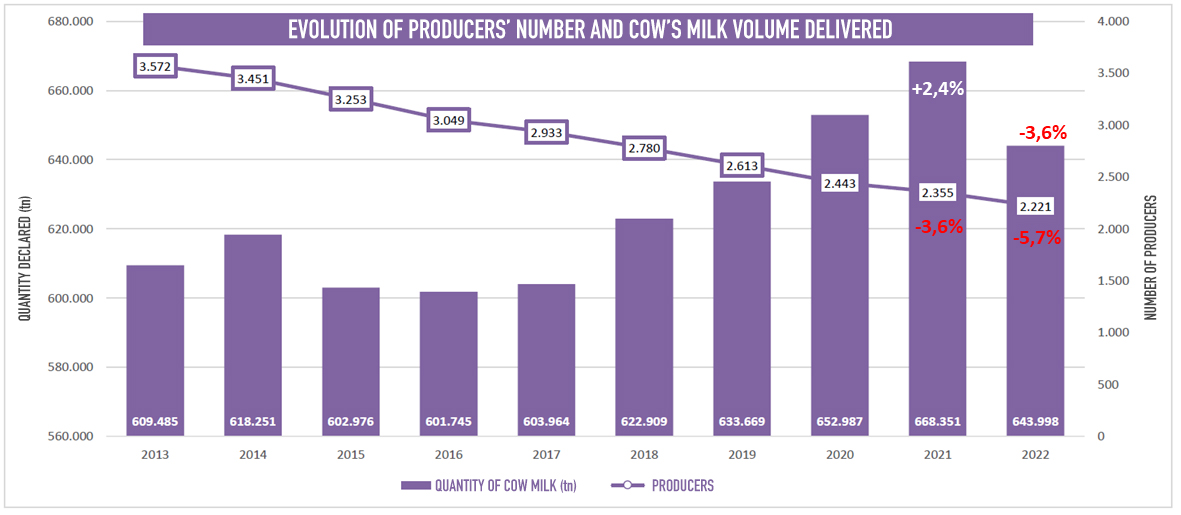
- a gradual decrease is observed, both in the number of human capital engaged in the production of cow's milk and in livestock. In particular, in 2021 there is a decrease in the number of producers by 3.6% but an increase in the quantity delivered by 2.4%, while in 2022 there is a decrease in the number of producers by 5.7% and a decrease in the quantity delivered by 3.6%. In the last decade, the number of cow's milk producers decreased by 1.351 producers. On the other hand, the population of cows for milk production in Greece has been decreasing for the last 10 years, and between 2013 and 2022 it decreased by 49 thousand heads. In particular, in 2022 the number of cows for milk production decreased by 10 thousand heads or by 12%, while on the contrary the number of cows e.g. for meat production etc. by 25 thousand heads compared to 2021 or by 20%.
Source: ELGO - Dimitra
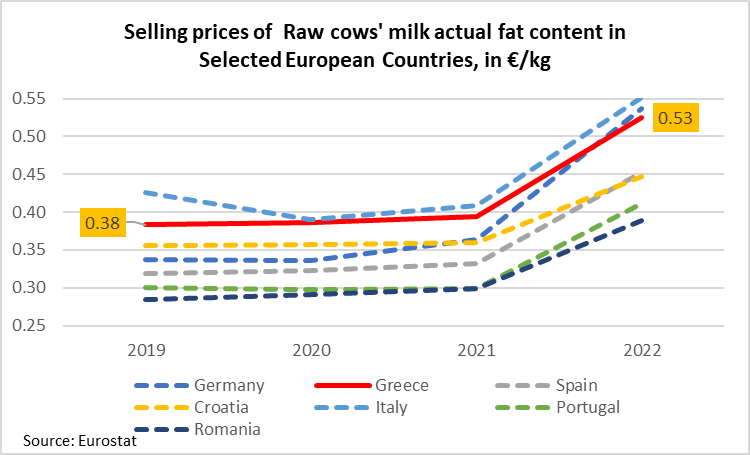
- According to Eurostat data, the price of Cow's milk received by farmers showed a relative stability in the years 2019 to 2021, while there was a price increase in 2022 in all European countries presented in the chart below.
- Specifically for Greece, it is noted as follows:
- The price in Greece is at a higher level than almost in all the countries presented in the chart below, except for Italy.
- The price of cow's milk at the production level increased from €0.39/kg in 2021 to €0.53/kg in 2022, or by 33%.
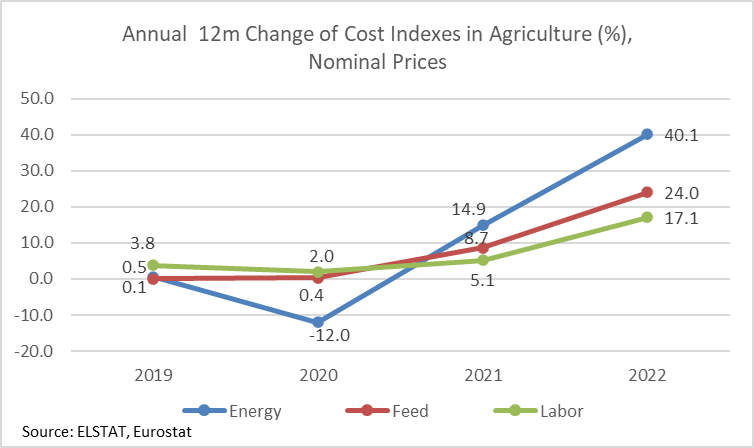
- At the same time, it was established from ELSTAT and Eurostat data and according to the evolution of livestock cost indexes that after 2020, Greek livestock farming faces high growth rates in key cost categories such as Energy, Animal Feed and Labor Costs. Especially in 2022, the energy index in animal livestock farming increased by 40%, the feed cost index by 24% and the labor cost index by 17%.
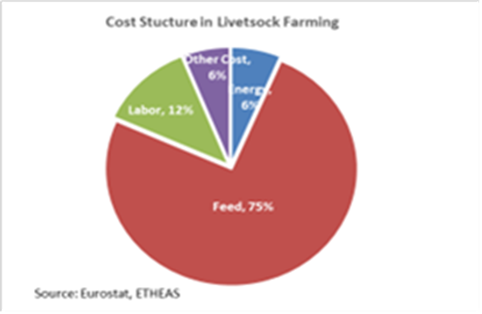
However, as the above costs do not have the same share in production, the relative weighting of the indexes was carried out, showing that the largest increase was presented in animal feed (veterinary medicines being also included) from +6.9% in 2021 to +19.2% in 2022.
- Finally, according to data sourced from the database of the Farm Accountancy Data Network (FADN), which monitors the income and business activities of farms in Europe, it appears that, in relation to 2008=100, the gross profit of farms stands at a level than operating costs for almost all years except for the period from the second quarter of 2022 to the fourth quarter of 2022. In the first half of 2023 gross profit fluctuated below operating costs (any subsidies have not been taken into account).
Regarding the part of the value chain that concerns processing in terms of the structure and evolution of basic cost categories, it is noted that:
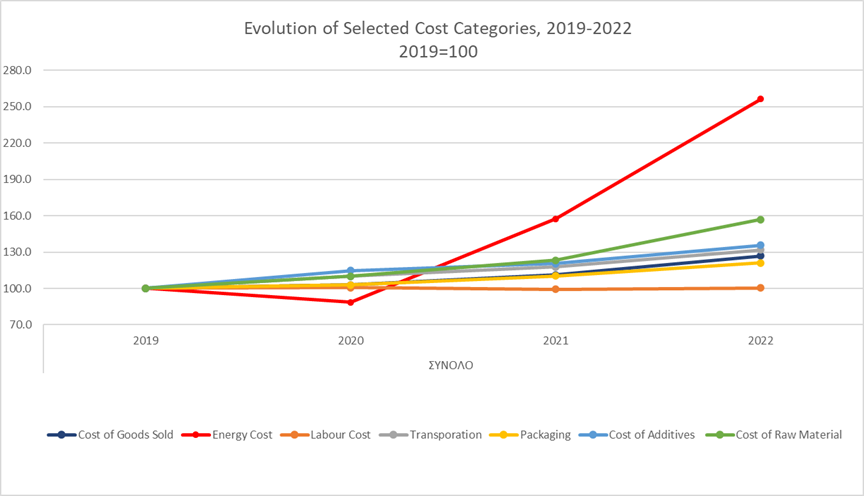
- Based on 2019 (2019=100), all cost categories have increased and, in particular, between 2021 and 2022, except for labor costs which remained stable.
- The most substantial increase was shown in energy cost which, compared to that of 2019, has more than doubled.
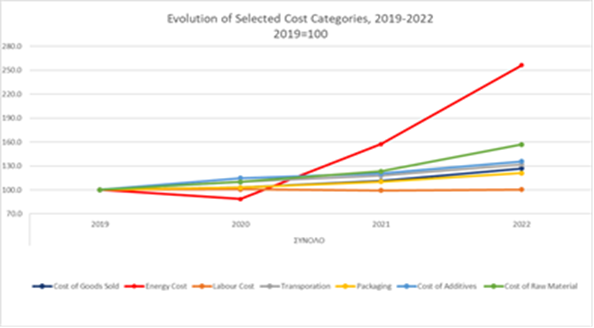 Source: Data provided by undertakings, Calculations by the HCC
- Regarding cost structure for dairy processing companies, the following chart is of particular interest.
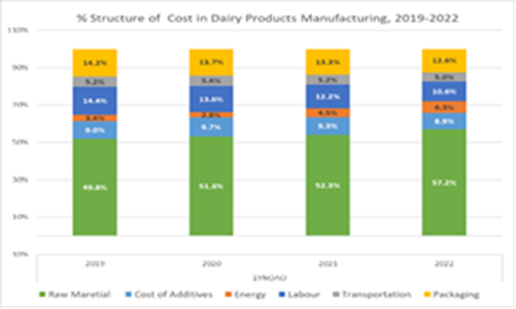
The next stage of the value chain is retailing, in particular retailing through Supermarkets.
- In the light of the data provided by the undertakings (Supermarkets) that are active in the retail sale of dairy products it turns out that the largest percentage (in value) refers to sales of Other Products ranging from 84.9% in 2019 to 85.2% in 2022 and followed by cheese ranging from 8.7% in 2019 to 9.1% in 2022, milk ranging from 3.7% in 2019 to 3.4% in 2022 and Yogurt from 2.6% in 2019 to 2.4% in 2022.
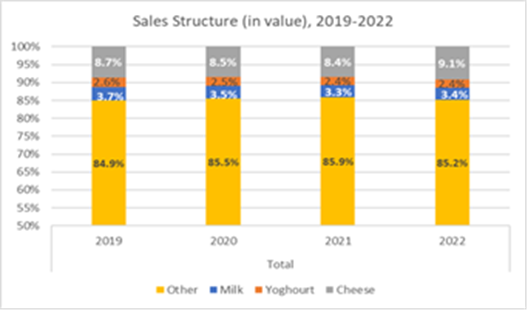
Source: Data provided by undertakings, Calculations by the HCC
- As far as the analysis of the selected cost categories is concerned, it appears that, also for Supermarkets, based on 2019 (2019=100), all cost categories have increased, mainly between 2021 and 2022. The most substantial increase was found in energy costs which, compared to 2019, has more than doubled.
Source: Data provided by undertakings, Calculations by the HCC
- In view of the above, it can be concluded that all stages in the value chain of fresh cow's milk, namely livestock breeding, processing and retail trade faced an increase in production costs, in particular after 2021, with predominant elements being animal feed (including veterinary drugs) in livestock farming, and energy in manufacturing and retail trade. Livestock farming is facing an additional issue related to the reduction of both human resources and livestock capital.
Analysis of cow's milk price in the value chain and the percentage of each stage
In this regard, you can find below the analysis of cow's milk price in the value chain and the percentage of each stage, over the period 2020-2022 as well as in the 1st half of 2022 and the 1st half of 2023.
- Apart from the responses to the DGC’s questionnaires on the cost and sales data and from the financial statements provided by the 4 Processors and the 5 Supermarkets, data on the final sale price of fresh cow's milk was also obtained from the database maintained by the HCC as of 2020, with updates based on the e-katanalotis platform. In addition, data was obtained from ELGO Dimitra regarding producer price of cow's milk.
- In respect of the methodology applied:
- The Processing rate was calculated as the Processing Selling Price - Producer Price - Cost of collecting milk from producers and distributing milk to retail – refunds
- A working hypothesis was made that the processing plants bear, mostly, the cost of collecting the raw material from producers and the cost of distributing the final product to Supermarkets. Also returns of fresh milk add to the processor’s costs. All fresh milk returns are, for the most part, forwarded by processors for disposal through certified animal product disposal entities
- The Retail rate, through Supermarkets, was calculated from the average Retail price from e-katanalotis minus the VAT – the (ex-factory) processing selling price.
- During the period 2020-2023, changes were observed both in the structure of the average price of fresh cow's milk and in the shares of each stage on the average price in the value chain of fresh cow's milk.
- Regarding the formation of the average sales price of fresh cow's milk and the share of each stage of the value chain, the following can be observed:
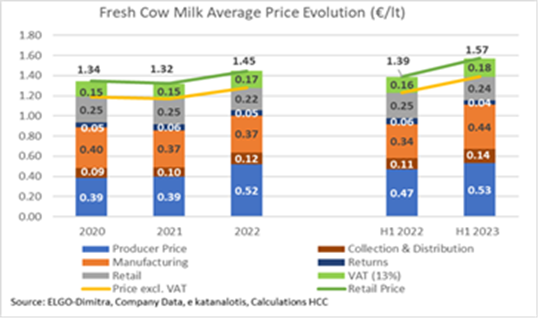
- The average annual producer's (breeder’s) selling price increased from 0.39 EUR/lt in 2020-2021 to 0.52 EUR/lt in 2022. Regarding the first half of 2023, the average price was equal to 0.53 EUR/lt while the respective price in the first half of 2022 was 0.47 EUR/lt. The average price corresponding to the collection and distribution of fresh cow’s milk increased from 0.09-0.10 EUR/lt in 2020-2021 to 0.12 EUR/lt in 2022 while reaching 0.14 EUR/lt in the 1st half of 2023.
- The share of processing in the setting of the final price of fresh cow's milk was estimated at 0.40 EUR/lt in 2020 and decreased to 0.37 EUR/lt in 2021 and 2022. In the 1st half of 2023, it was 0.44 EUR/lt while in the respective half of 2022 it was 0.34 EUR/lt. In other words, a gradual contraction of the share of processing in the final price was observed over the period 2020-2022, with recovery trends in 2023.
- Fresh milk returns were found to play a less important role. The average refund price corresponding to 1 lt of sold fresh cow's milk was found to be 0.04-0.06 EUR/lt, in the period 2020- 1st half of 2023.
- The amount corresponding to retailing was 0.25 EUR/lt in 2020-2021 and 0.22 EUR/lt in 2022. In the 1st half of 2023 it was 0.25 EUR/lt compared to 0.24 EUR/lt in the preceding financial year. The comparison of the data available biannually for 2022/2023 shows the existence of a trend for retail price to return to 0.24 EUR/lt.
- A tax amounting to 0.15 EUR/lt, 0,17 EUR/lt in 2022 and up to 0.18 EUR/lt in 1st half of 2023, was added to the price formed by the stages of the value chain considered.
- Regarding the shares of producers in shaping the final price in the value chain, they increased from 28.8% in 2020, to 33.9% both in the 1st half of 2022 and in the 1st half of 2023. The most important increase was observed between 2021 and 2022 by ~6%.
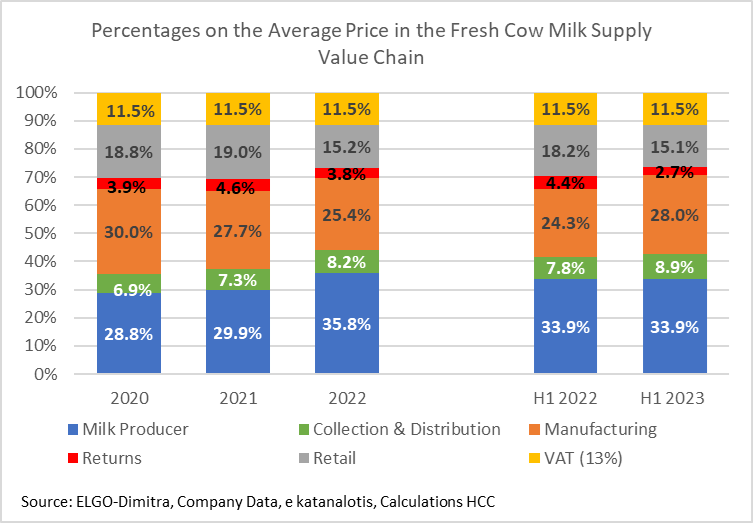
- Regarding processing shares in the value chain, a relative decrease was also observed, from 30% in 2020 to 25.4% in 2022, while an increase to 28% was also observed during the 1st half of 2023.
- Fresh milk returns were found to have a less important (but appreciable) role which, expressed as a percentage in the value chain, it ranged from period to period between 2.7% and 4.6%.
- Minor (in relation to production/processing) but equally significant changes were observed in retail, as the relevant percentage in the value chain decreased from 18.8% in 2020, to 15.1% in 2022. That is a decrease of 3.7 %. The rate in the 1st half of 2023 was 15.1% compared to 18.2% in the 1st half of 2023.
- Tax remained stable during the reference period. In Greece, the sale of milk is taxed with VAT of 13%, which corresponds to the 11.5% of the final consumer price in the product's value chain, being one of the highest in the food product category in the EU.
In conclusion, and comparing 2020 with the 1st half of 2023, in terms of the formation of the final price of fresh cow's milk, what is observed in the value chain is a relative drop in the percentage corresponding to the margin of processing (-2%) and retail (- 3.7%) by approximately 5.7% overall and an increase in the producer's rate by 5.1% and in transport costs (collection and distribution) by 2%.
The increased producer’s share of the in the formation of the final price of fresh cow's milk between 2020 and the first half of 2023 is explained, at least in part, by the significant increase in production costs, primarily in the costs of feed and veterinary drugs and secondly in energy and labor costs.
These observations are in line with the general inflation trends and the increases that have been observed in production costs (feed, energy, etc.).

