The Hellenic Competition Commission (HCC), acting within its powers, carried out an investigation into the market for healthcare materials. This action was deemed necessary following numerous consumer complaints and press coverage regarding, on the one hand, significant price increases of the products in question at a number of retail outlets, and shortcomings of these products, on the other, which are likely to stem from business practices in the distribution chain that may fall under the provisions of Law 3959/2011.
In this respect, on March, 20th 2020, the HCC sent an online questionnaire, requesting purchase and sales data for the period from November 2019 to March 2020, to 4056 undertakings active in the production, import and marketing of healthcare materials, in particular surgical masks and disposable gloves, as well as other products such as antiseptic wipes and antiseptic solutions.
Sending thousands of questionnaires via an online programme and, then, swiftly categorising and statistically and econometrically analysing the collected data through data analytics tools to decide on further action is an innovative way adopted by the HCC for conducting its investigations (and the first time to date). After the expiry of the deadline for responses, data were extracted from almost 3000 companies that responded to the questionnaire and a multi-member group of scientific experts, composed of economists and econometricians, has carried out their processing and analysis.
Among the respondents to the questionnaire, were many pharmacies because of the existence of a significant number of this category of businesses in Greece (about 10,000 in total) as well as undertakings from all the levels of the distribution chain for the products concerned, namely import, production and wholesale levels, while most of the companies that responded to the investigation are based in the prefectures of Attica and Thessaloniki.
Figure 1: Distribution of undertakings by sector of activity and geographical location
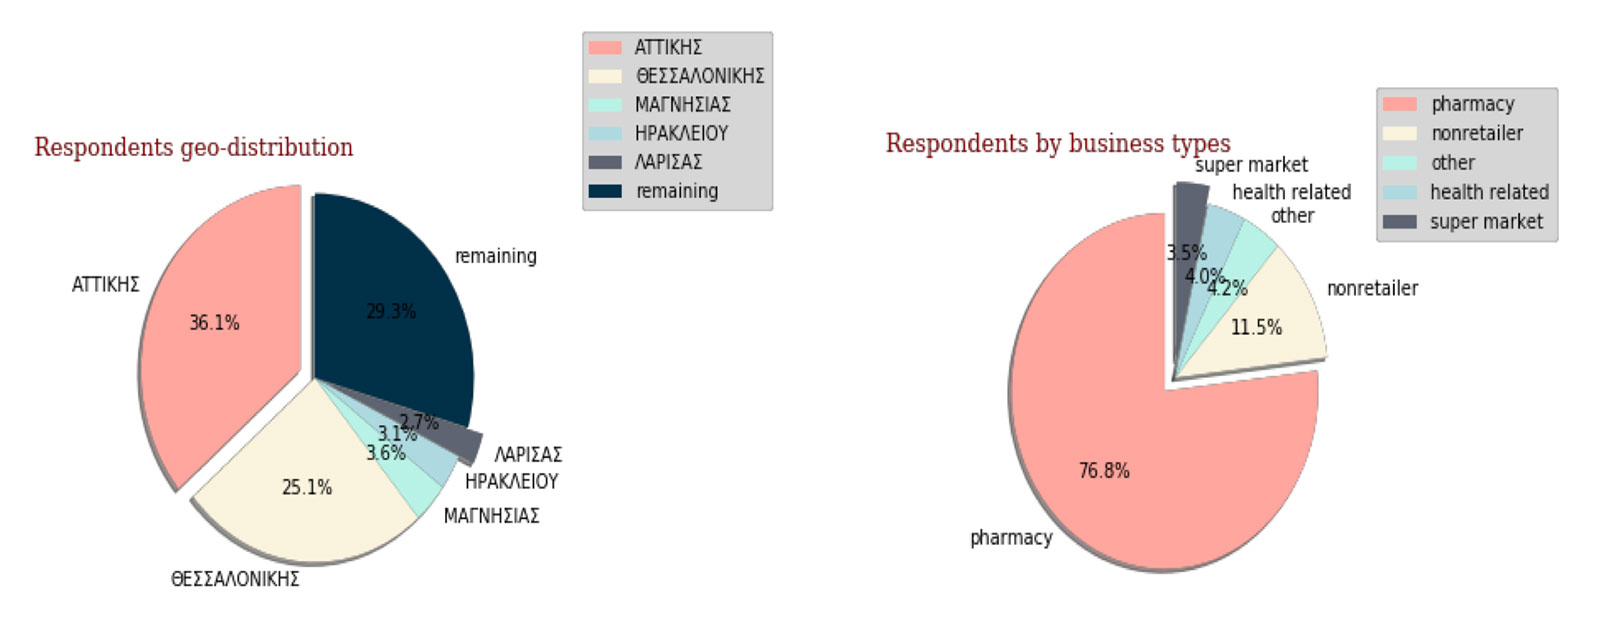
Almost all prefectures are represented in the survey, while the representation of the islands is more sparse, with the majority of comments mainly coming from the larger Cycladic, Dodecanesian and Ionian islands and Crete.
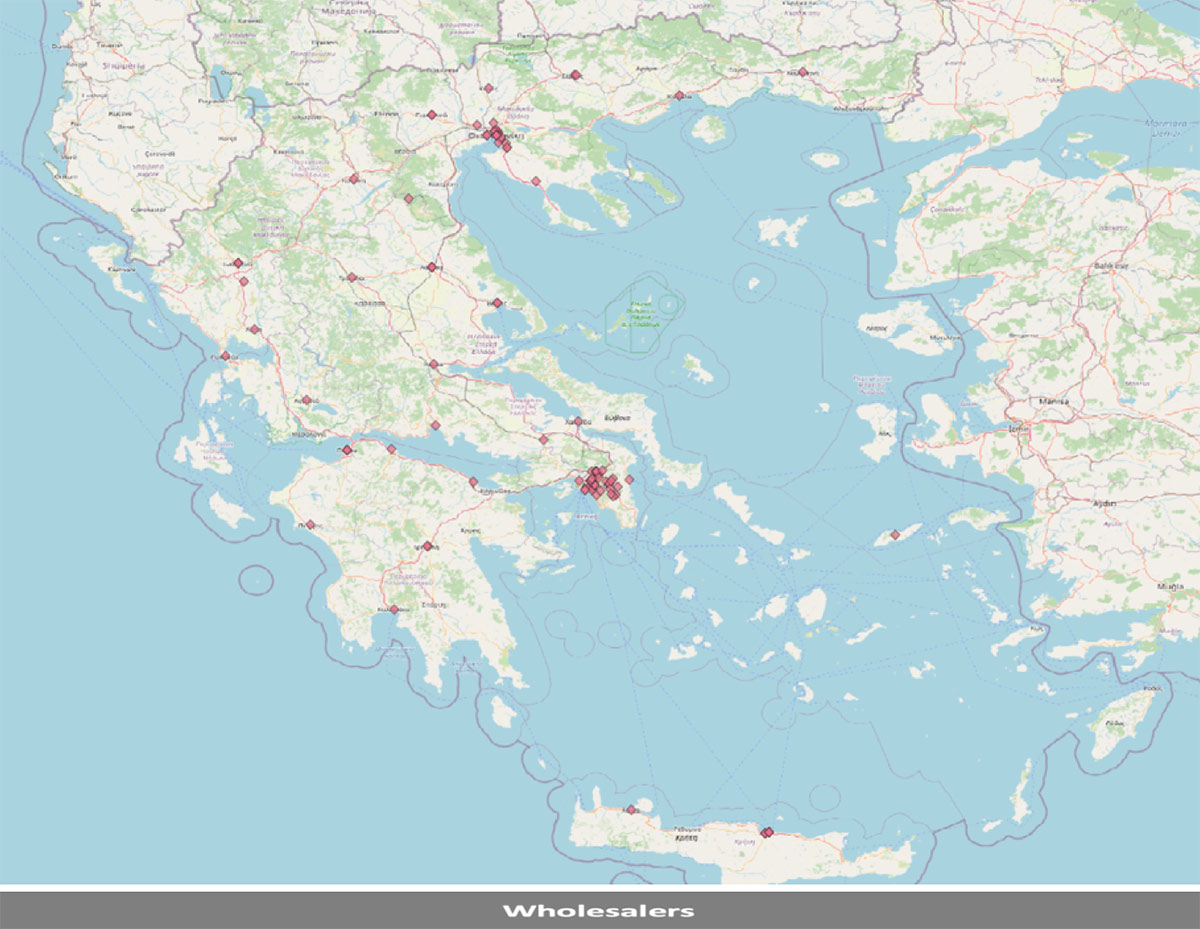
The following map shows the geographical distribution of the registered companies which are active in wholesale distribution (without that necessarily being their sole activity). Apart from their distribution in mainland Greece, particularly in large urban centers, their respective island distribution is sparse and basically observed in Crete, which leads to the main conclusion that the supply of retail outlets in the island areas involves additional transportation costs.
Wholesalers geo-distribution
The investigation revealed that, during the period considered, there seems to be an increase in companies that are active in the retail market for all the healthcare materials and products at issue. The sharp rise in demand for these products has been accompanied by an increase in the number of businesses that are marketing or selling these products, suggesting a healthy market response. On the basis of the sample, the increase in the retail outlets for antiseptic solution and disposable gloves appears to be larger.
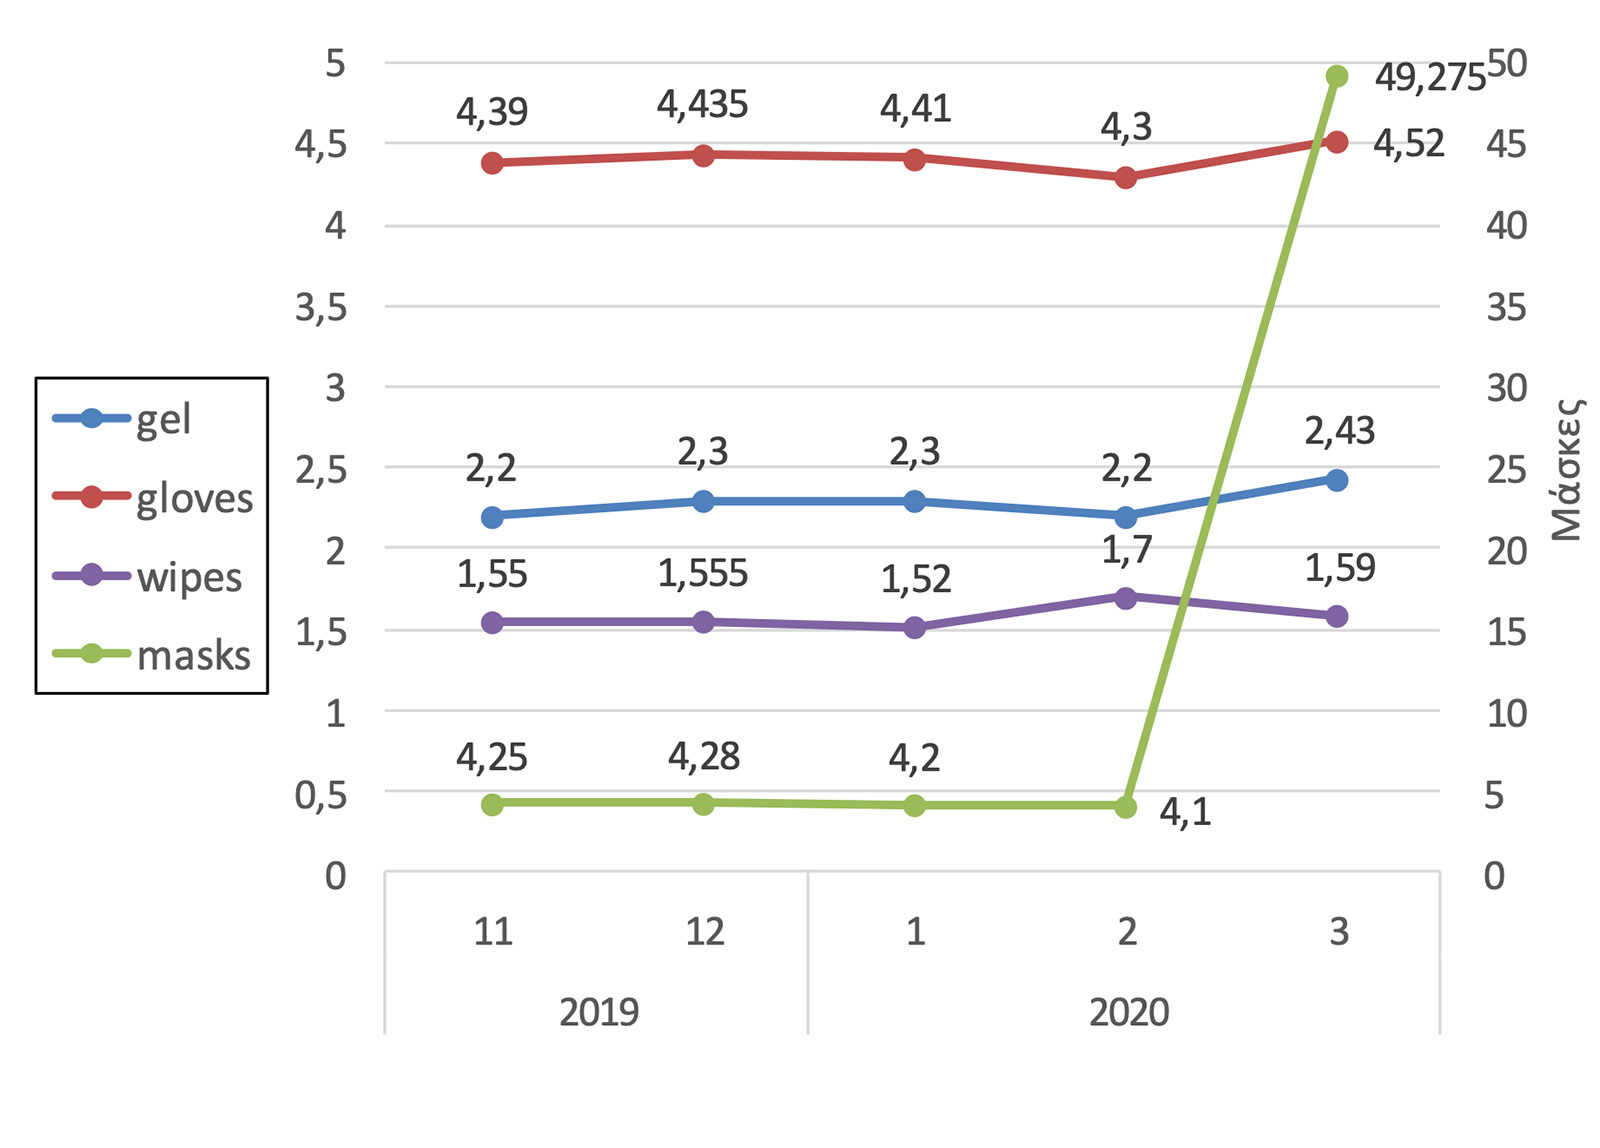
On the basis of the median sale prices of all products as reflected regarding all the companies investigated, it seems that in the median sale price a sharp increase was observed especially in the disposable surgical masks from February 2020 onwards. Τhe median price of antiseptic gels and disposable gloves has slightly increased, while a marginal drop in the price of antiseptic wipes was observed.
The sale of these products by more companies seems to have curbed the rise in prices, while the increase in the price of masks is likely to have resulted from stock shortages during the period considered.
Figure 2: Median sale price for all undertakings
(Masks on the right axis)
However, no systematic increase in the average and / or median gross profit margin from the sale of the healthcare product concerned during the investigation period has been confirmed. In particular, it was found that no substantial fluctuation has occurred in the median gross profit margin during that period, which was at a similar level for different products.
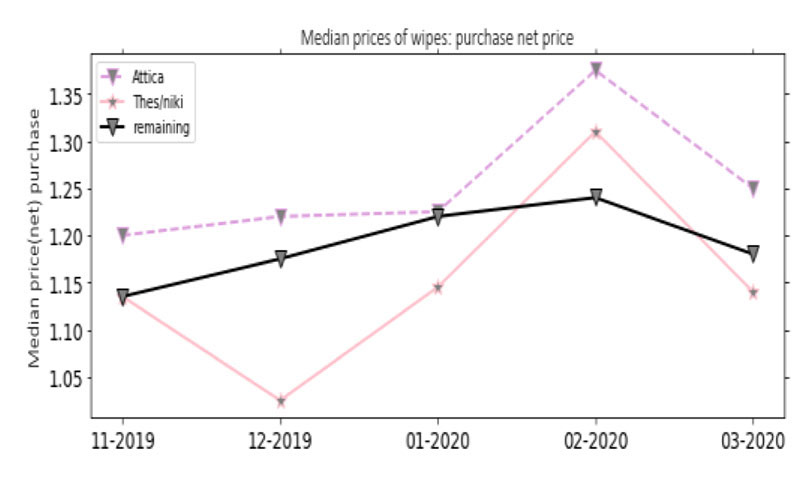
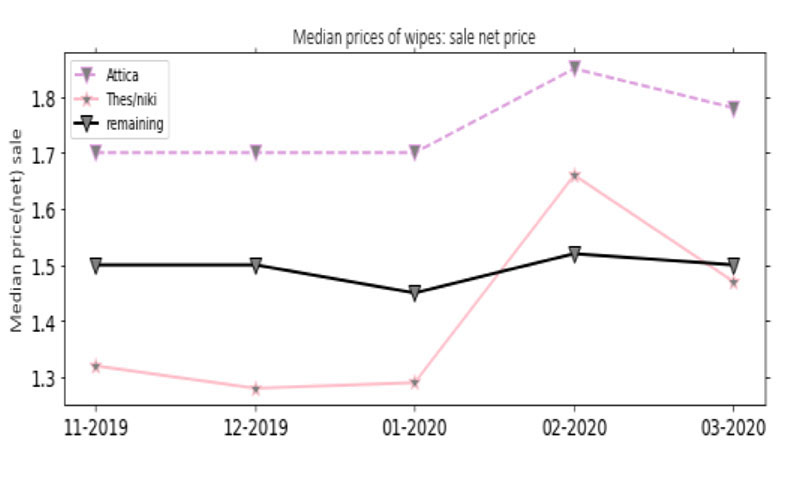
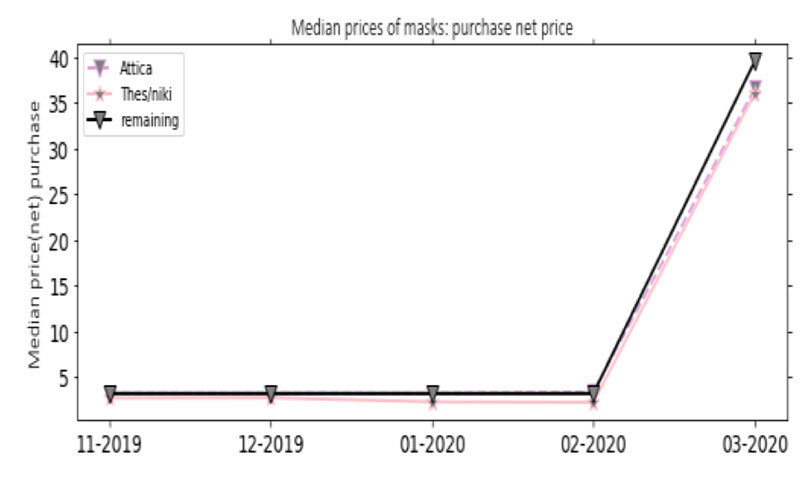
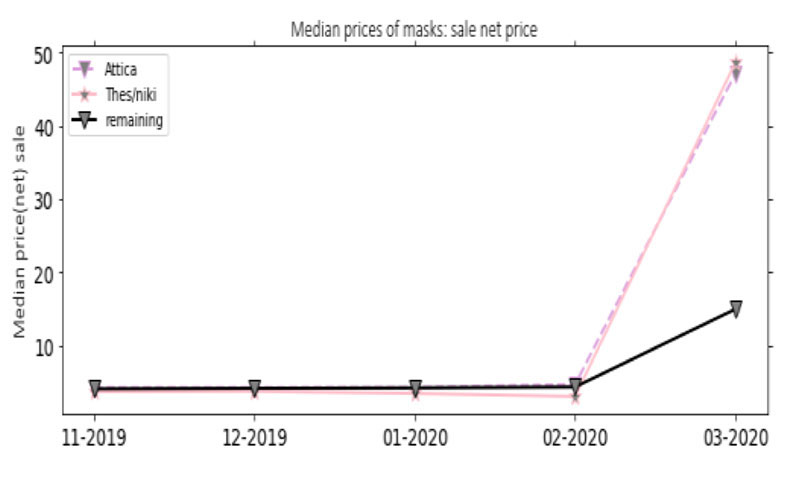
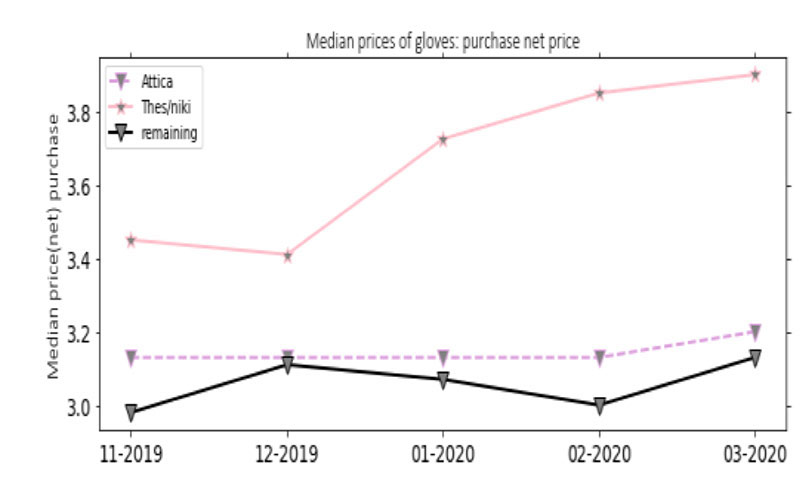
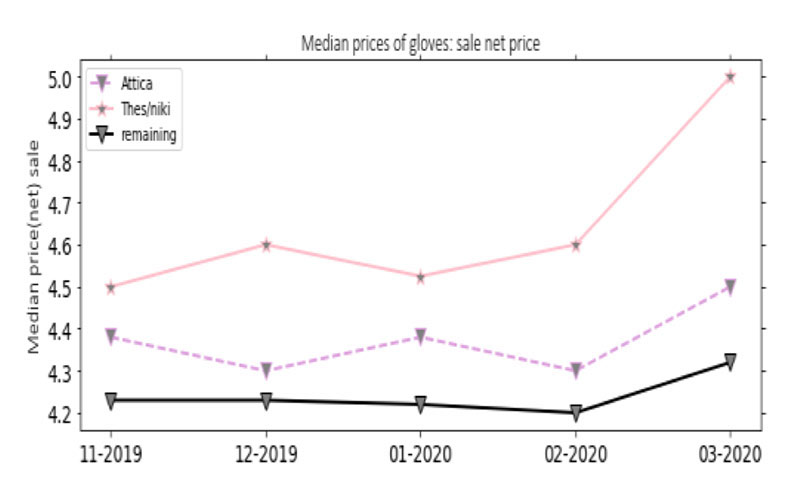
Comparing the median purchase price in the period from 1.11.2019 to 31.3.2020, between the prefectures of Attica, Thessaloniki and the rest of the territory, the same price behavior was observed regarding the products concerned[i]. Median purchase and sale prices seem to follow the same pattern in the two major prefectures of the country, with Thessaloniki showing higher prices in the market for disposable gloves, Attica showing higher prices for antiseptic wipes and prices being at approximately the same levels throughout Greece.
Figure 3: Median purchase and sale price of the products concerned from November 2019 to March 2020 and comparison between the two largest prefectures and the rest of the territory
|
Antiseptic wipes |
|
|
Median purchase net price |
Median sale net price |
 |
 |
|
Surgical masks |
|
|
Median purchase net price |
Median sale net price |
 |
 |
|
Disposable gloves |
|
|
Median purchase net price |
Median sale net price |
 |
 |
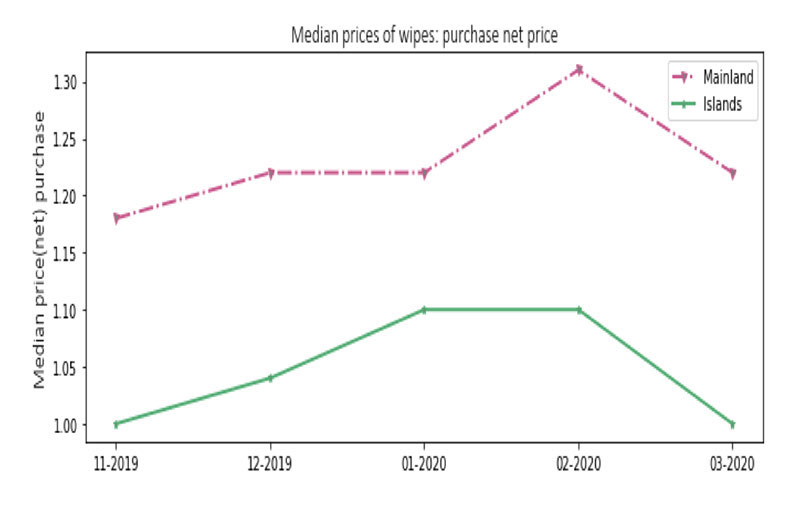
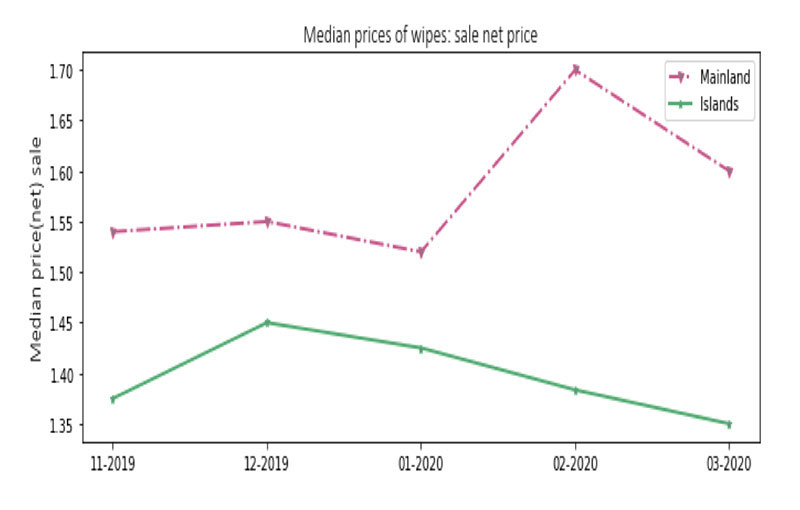
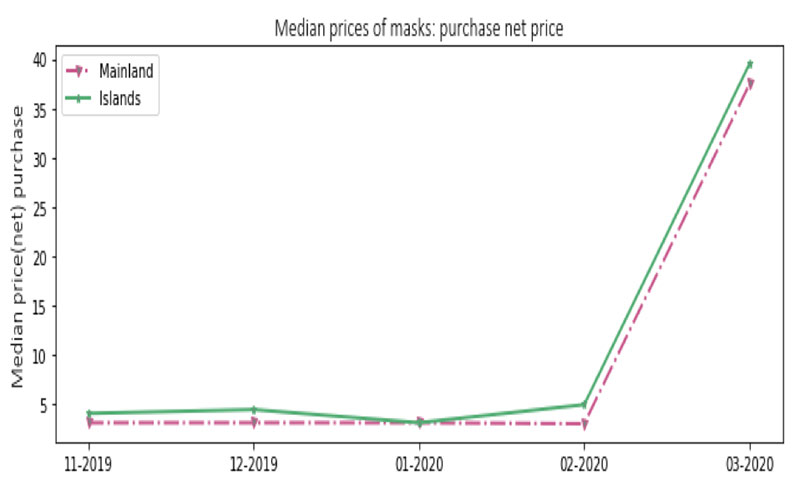
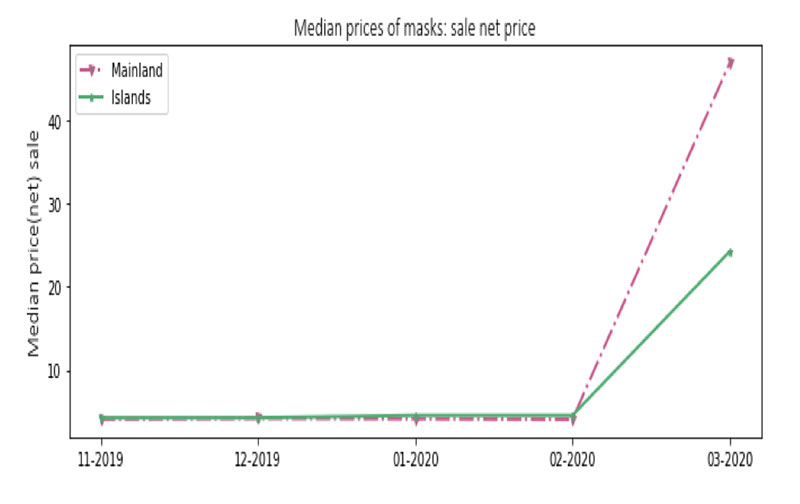
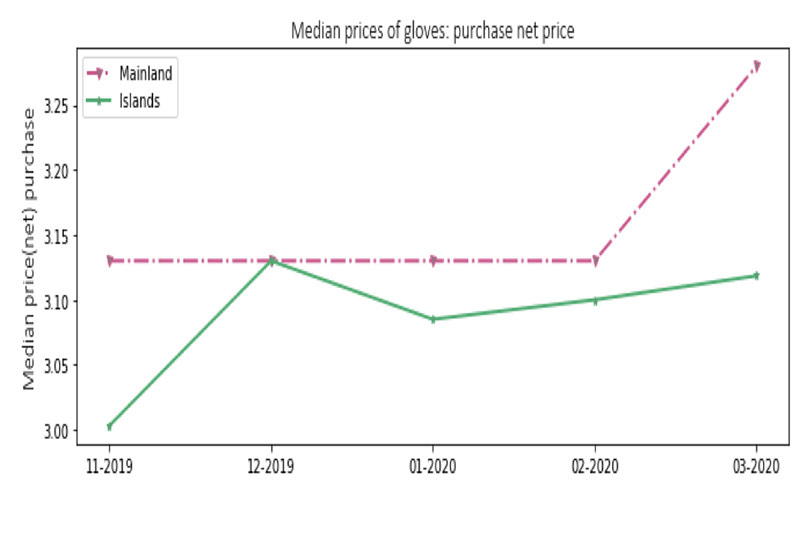
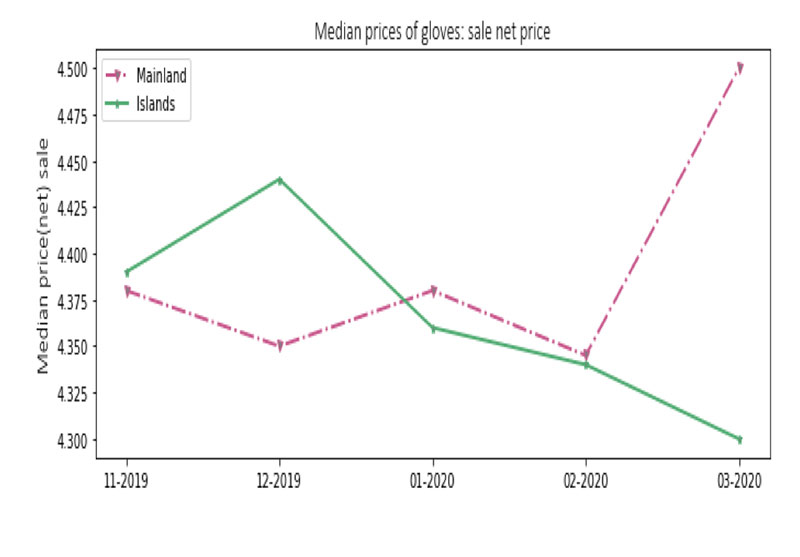
Furthermore, a similar behavior was observed for the median purchase and sale price of the products under consideration between mainland and island Greece, as well as between urban and non-urban centers. The following figure shows the evolution of prices of antiseptic wipes, masks and disposable gloves in mainland and island Greece. As far as antiseptic wipes and gloves are concerned, it seems that prices are usually lower in the island areas compared to the mainland areas. Interestingly, the median sale price for masks is slightly lower in the island regions after February 2020 compared to the corresponding price in the mainland and in relation to the respective median purchase price.
Figure 4: Median purchase and sale price of the products under consideration, from November 2019 to March 2020, and comparison between mainland and island Greece
|
Antiseptic wipes |
|
|
Median purchase net price |
Median sale net price |
 |
 |
|
Surgical masks |
|
|
Median purchase net price |
Median sale net price |
 |
 |
|
Disposable gloves |
|
|
Median purchase net price |
Median sale net price |
 |
 |
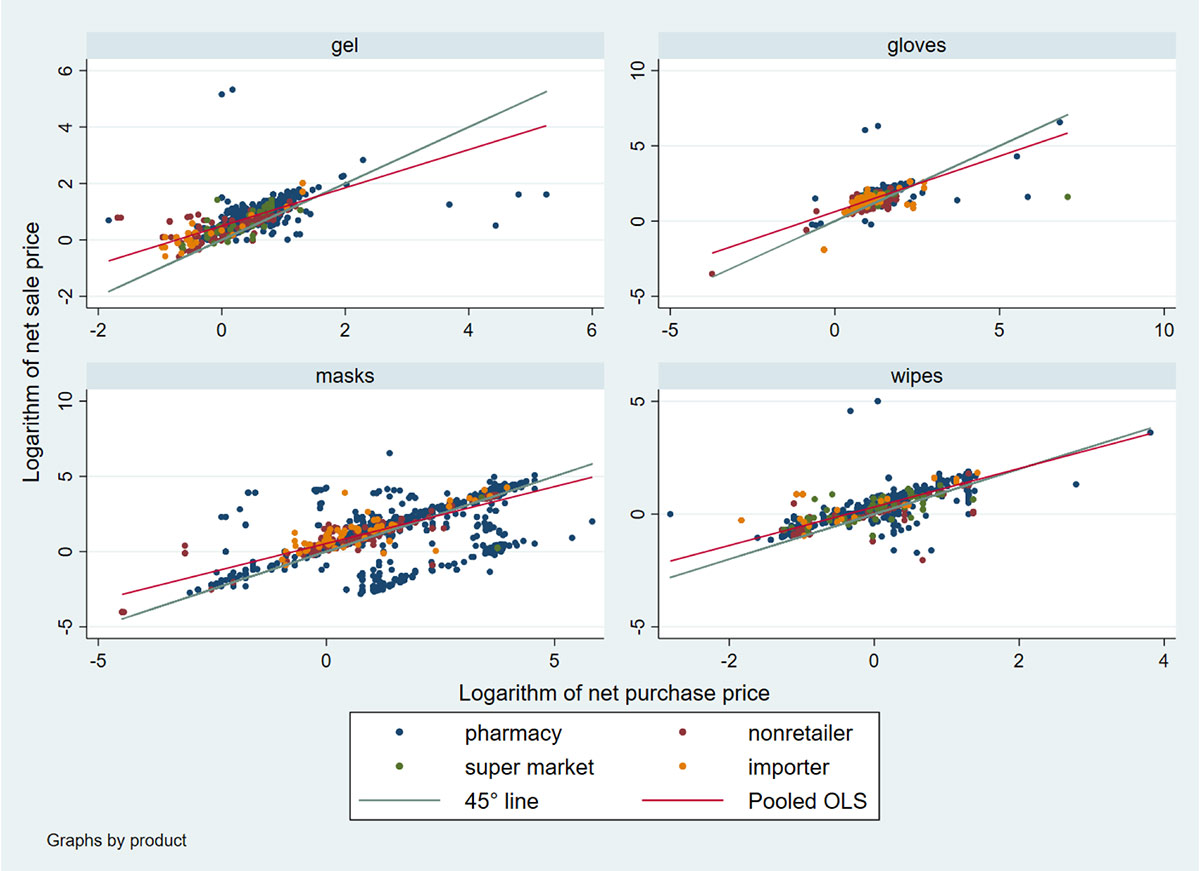
The following scatter plot shows the logarithms of purchase price (horizontal axis) and sale price (vertical axis), for all months and all undertakings.
- Compared to the 45° line, most observations seem to suggest the existence of a fixed mark-up, while there are also some outliers.
- Several observations are below the 45° line, implying that the sale price is lower than the purchase price. This is probably due to the fact that the purchase price does not always correspond to the products sold in that month, i.e. sales concerned the product stock from previous months. This is particularly evident in masks.
Figure 5: Scatterplot of purchase and sale price
According to the statistical and econometric processing of the available data, the increase in the retail sale price of the healthcare materials considered comes mainly from the pass-through of the increase in the wholesale price. In addition, the study found that the pass-through of the wholesale price increase to antiseptic wipes and disposable gloves was higher in pharmacies than in supermarkets. Regarding masks, the results showed that the undertakings which were also active at another distribution level in addition to retail, i.e. production, imports or wholesale, showed higher prices than those active exclusively in retail.
Examining the pass-through rate of change in the purchase price of masks to the sale price to end consumers, it appears to be higher in March 2020. Furthermore, the greater variation in the price pass-through rate appears in the sale of disposable gloves in February 2020.
The following table shows indicatively the findings of an econometric model using panel data on price pass-through to consumers over time.
Findings: Interactions with product and business type
|
Variables |
Panel Data |
|
pharmacy_purchase_price |
|
|
gel |
0.580*** |
|
(0.127) |
|
|
gloves |
0.489*** |
|
(0.188) |
|
|
masks |
0.889*** |
|
(0.017) |
|
|
wipes |
0.764*** |
|
(0.14 1) |
|
|
supermarket_purchase_price |
|
|
gel |
0.677*** |
|
(0.099) |
|
|
gloves |
0.523** |
|
(0.230) |
|
|
masks |
|
|
wipes |
0.334* |
|
(0.180) |
|
|
health_purchase_price |
|
|
gel |
0.866*** |
|
(0.061) |
|
|
gloves |
0.202*** |
|
(0.060) |
|
|
masks |
0.655** |
|
(0.265) |
|
|
wipes |
0.592*** |
|
(0.096) |
|
|
other_purchase_price |
|
|
gel |
0.694*** |
|
(0.070) |
|
|
gloves |
0.514** |
|
(0.200) |
|
|
masks |
0.986*** |
|
(0.008) |
|
|
wipes |
0.221 |
|
(0.156) |
|
|
Robust standard errors in parentheses |
|
|
***p<0.01, **p<0.05, *p<0.1 |
|
The findings of the above linear regression only for retailers[i] examine the pass-through rate in each product-business type combination. Judging from the confidence intervals resulting at a statistical materiality level of 5%, the ceiling is rather close to 1, which corresponds to a perfectly competitive behavior. Therefore, where the estimated rate is close to 1, the business cannot absorb an increase in the price and therefore passes it through to consumers. The above table of findings shows that, in pharmacies, the price pass-through rate is high for masks and antiseptic wipes and lower for antiseptic gels and disposable gloves. This may be due to the combined facts that pharmacies specialise in the sale of specific products and, at the same time, they face intense competition from competing companies[ii].
Finally, on the basis of the purchase outliers analysis for the products concerned, it was observed that:
- 1% of the highest net purchase prices per month considered concerns companies mainly located in the two larger prefectures of Attica and Thessaloniki and
- 1% of the highest net purchase prices per month considered concerns mainly pharmacies.
Similarly, on the basis of the sale outliers analysis for the products concerned, it was observed that:
- 1% of the highest net sale prices per month considered concerns companies mainly located in the two larger prefectures of Attica and Thessaloniki, while the aggregated data per month considered indicate that the majority of companies with the highest sale prices are based in the prefecture of Attica and
- 1% of the highest net sale prices per month considered concerns mainly pharmacies.
The latter data items as well as further data collected by companies active in the wholesale of healthcare materials will be used to identify any cases of abusive pricing by companies that hold a longstanding nationwide and / or temporary local dominance in the markets at issue. The HCC will also periodically update the investigation in light of any new data.
It is further noted that, under the present circumstances with the Covid-19 pandemic affecting the country, the HCC will remain vigilant with regard to any developments and will continue to intervene for possible violations of the provisions of Law 3959/2011 and Articles 101 and 102 of the Treaty on the Functioning of the European Union (TFEU), with a view to safeguarding the competitive market structure and protect consumer interests and economic growth.
[i] The findings from the prefecture of Thessaloniki concerning antiseptic gels are not included herein due to insufficient relevant observations.
[i] The said analysis uses fixed effects in the VAT-product combination
[ii] It should be noted that although the online questionnaire specified the “masks” product category, for which companies were required to submit data, the data submitted possibly concern different types of masks and gloves which also differ in prices (e.g. latex masks or vinyl masks, powdered or non-powdered gloves), so the interpretation of the results must be done also taking into account this parameter.


