

Overview of the market-mapping results
By its Decision adopted on the 8th of February 2023, the Hellenic Competition Commission launched a mapping study on the conditions of competition in the product markets for: (a) laundry detergents, (b) fresh whole milk, (c) baby milk, (d) cheese and (e) cow yoghurt, by virtue of the provisions of Law 4886/2022 (article 14(2) subpar. s).
According to the above provisions, “the Hellenic Competition Commission … (m)ay initiate a mapping study to assess the competitive conditions of competition in any market or sector of the economy, where required for the effective exercise of its powers.”
The purpose of the market mapping with regard to the above products is to extend the HCC’s investigation launched into a number of products by the sector inquiry into basic consumer goods and the relevant final report published in March 2021, also following the creation of the HCC’s Consumer Goods Task Force, taking into account the latest developments in the market due to the significant price increase in certain product categories, changes in consumer habits, and measures adopted by the State.
The market mappings allow the HCC to investigate, in a relatively short period of time, issues mainly pertaining to market organisation and structure that are raised in the markets concerned, and to better target any possible ex officio investigations, or other types of its interventions in the relevant markets. These mappings are part of the HCC's activities aimed at dealing with high prices on the market as well as at increasing the effectiveness of its investigations to detect possible anti-competitive practices in the markets for basic consumer goods.
In particular, the mapping study on the competitive conditions in the market for Laundry Detergents focused on a) the market share evolution regarding the 11 largest Supermarkets (SMs) and the suppliers’ shares in the sales of these 11 SMs (for both branded and private label products) i.e. in the upstream market b) the effect of the Household Basket (HB) mechanism on prices of branded and private label products and c) the change in consumers' purchasing habits, by comparing branded products with private label products.
As part of the above mapping study on the Laundry Detergent markets, questionnaires were sent by the Directorate-General for Competition to 11 retailers (supermarkets) active in these markets. The time period for which data was collected extends from 1/2/2022 to 1/2/2023. No other distribution channels were considered.
In particular, it is noted that:
Over the period 1/2/2022-1/2/2023 examined by the HCC, liquid detergents represented a percentage of 61% of total sales, powder detergents represented a 24% and detergent pods represented 15%.
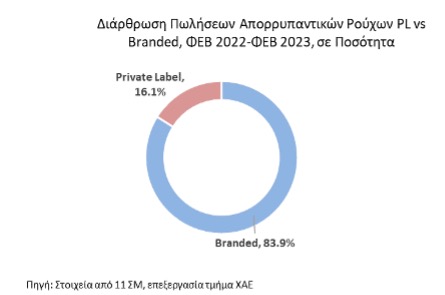 Sales Structure: PL vs Branded Laundry detergents, FEB 2022-FEB 2023, in sales volumes
Private Label, 16,1% Branded, 83,9% Source: Data from 11 SMs, processed by the HCC’s Department for Market Mapping and Research (MMR)
Regarding the breakdown of sales between Private Label products and Branded products (Branded), it is noted that in the total sales value, 92% represents branded products and 8% private label products while, based on the sales volumes, 84% concerns branded products and 16% concerns private label products. This is because private label products have a lower final selling price.
In terms of sales shares:
- Regarding supermarkets, none of them presents a market share exceeding 40%.
- Regarding suppliers, none of them presents a market share exceeding 40%.
- Overall, it is observed that the shares of sales (in terms of value) of all 11 supermarkets did not change significantly during the period considered and it seems that they were not affected by the implementation of the Household Basket (HB). From the suppliers’ side, however, there were fluctuations in their sales from the 11 supermarkets, mainly among the large suppliers of branded products.
In terms of price developments:
- Regarding price developments (weighted average price per pod net of VAT), it is noted that, in private label detergents the prices (average price per pod) were at a lower level compared to branded detergents and showed a marginal upward trend during the considered period from February 2022 to February 2023.
- Overall , the ΗΒ had a stabilising effect on prices only for the products included in it.
- Branded products (powder – liquid detergents) that were not included in the HB showed, over the period considered, the largest increase in the weighted price per pod. In particular, during the period considered, the average price per pod for branded powder and liquid detergents that were not included in the HB increased by 16%.
- Following the implementation of the HB mechanism, the private label products that were included in the basket showed a small price drop. Based on the fixed-effects regression analysis using panel data, where the product is defined as the combination of SMs and barcode and the time variable is defined as the date/price (log normalized price) of the products entering the HB is reduced by an average of 8,27%, while the price (log normalized price) of the products removed from the HB increases more, i.e. on average by 8.69%
- Laundry detergent pods, not included in the HB, are more expensive than other laundry detergents and showed an upward trend and sharp price fluctuations over the period considered, between February 2022 and February 2023.
In terms of purchasing habits:
- Between February 2022 and February 2023, no change is observed in the sales structure (in terms of volume) for detergents in terms of sales of branded and private label products. Both at the beginning and at the end of the period considered, the percentage ratio was as follows: private label products: 16%, branded products: 84%.
- No consumer switching from branded products to private label products was observed since the initiation of the HB as there is only a marginal increase in the percentage of sales of private label products, from 15.3%, three weeks before the full implementation of the HB, to 15.6 % in period presenting the last available data.
Sales structure (Q) for Branded and Private Label Laundry Detergents, Filtered by their inclusion or non-inclusion in the HB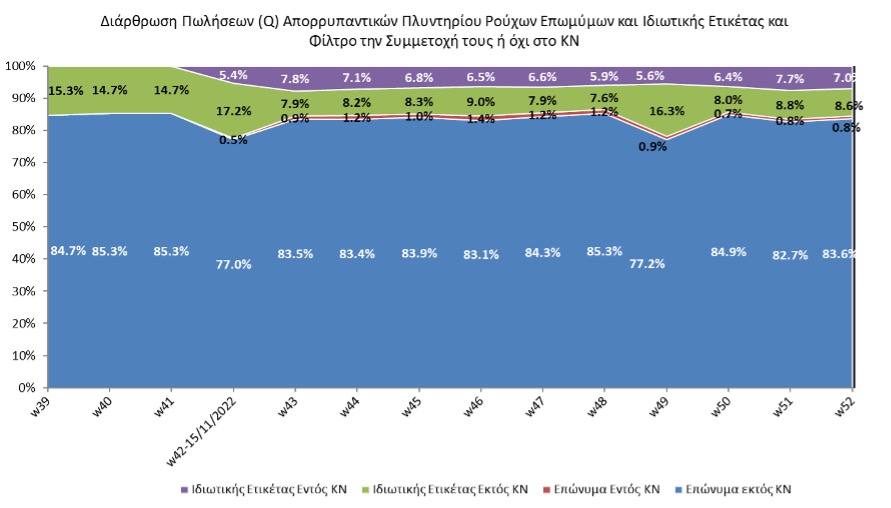
⸋ ΗΒ Private Label Products ⸋ Non-HB Private Label Products ⸋ HB Branded Products ⸋ Non-HB Branded Products
- It is further noted that the percentage of sales of products included in the HB did not increase, but remained at levels below 8.5% throughout the period considered, with products not included in the HB representing over 90% of sales (in volume). The above graph shows that there is was no change in consumer preferences since the introduction of the Household Basket between branded and private label products. On the contrary, there is a shift of consumers from non-HB private label products to HB private label products, where the total percentage of private label products was apportioned between the HB products and the non-HB products.
- Also, a small percentage of consumers preferred branded products included in the HB (from 0.5% at the beginning of the period considered to 0.8% at the end of the same period).